Factory Floor 2.0: Real-Time Production Tracking
Factory Floor 2.0: Real-Time Production Tracking
Client
Orient Craft
Orient Craft
Year
2023
Summary
Revamping Ridged’s brand identity and digital presence with creative brand identity and captivating digital design solutions.
Diabetes app with predictive glucose insights, personalized dosing, and care-circle support.
Revamping Ridged’s brand identity and digital presence with creative brand identity and captivating digital design solutions.
Overview
Overview
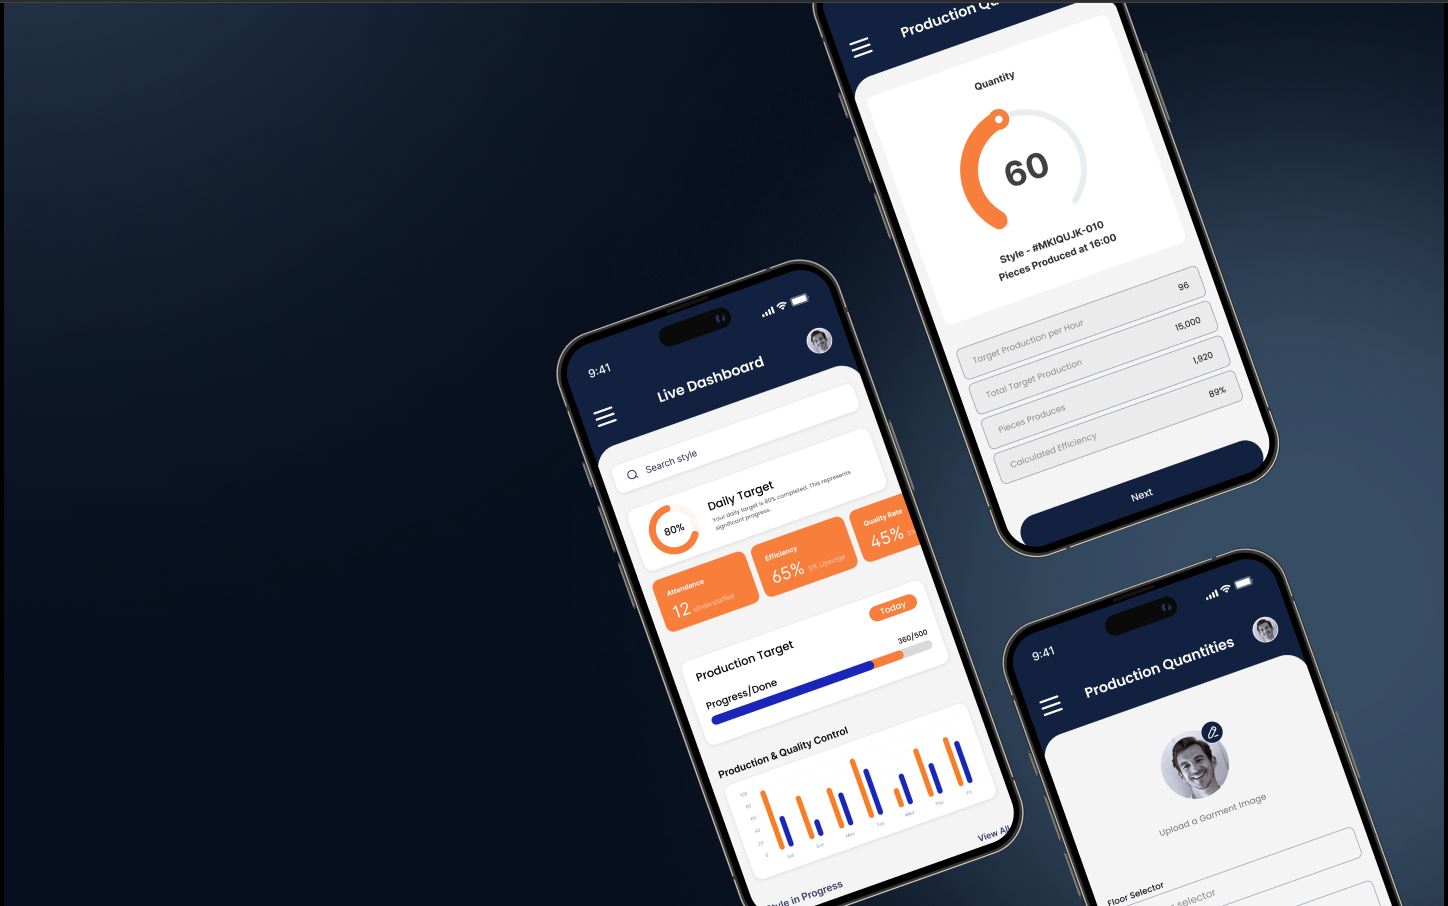
ThreadTrack is a mobile app that captures real-time production data from the sewing line, helping teams log units, flag delays, and stay aligned across departments. Built with Orient Craft, it replaced paper logs and WhatsApp updates with a centralized, tap-to-log system designed for high-volume, fast-paced floors. I led the full design process — from on-site research to prototyping and testing — ensuring it fit seamlessly into daily routines while improving visibility and coordination.
ThreadTrack is a mobile app that captures real-time production data from the sewing line, helping teams log units, flag delays, and stay aligned across departments. Built with Orient Craft, it replaced paper logs and WhatsApp updates with a centralized, tap-to-log system designed for high-volume, fast-paced floors. I led the full design process — from on-site research to prototyping and testing — ensuring it fit seamlessly into daily routines while improving visibility and coordination.
ThreadTrack is a mobile app that captures real-time production data from the sewing line, helping teams log units, flag delays, and stay aligned across departments. Built with Orient Craft, it replaced paper logs and WhatsApp updates with a centralized, tap-to-log system designed for high-volume, fast-paced floors. I led the full design process — from on-site research to prototyping and testing — ensuring it fit seamlessly into daily routines while improving visibility and coordination.
Client
Client
Orient Craft
Orient Craft
Industry
Industry
Manufacturing
Manufacturing
Service
Service
Task Analysis
Task Analysis
Interface Design
Interface Design
Duration
Duration
30 weeks
30 weeks


Key Insights
Sewing Opreations
Sewing Opreations
Sewing Opreations
Batched Logging
Batched Logging
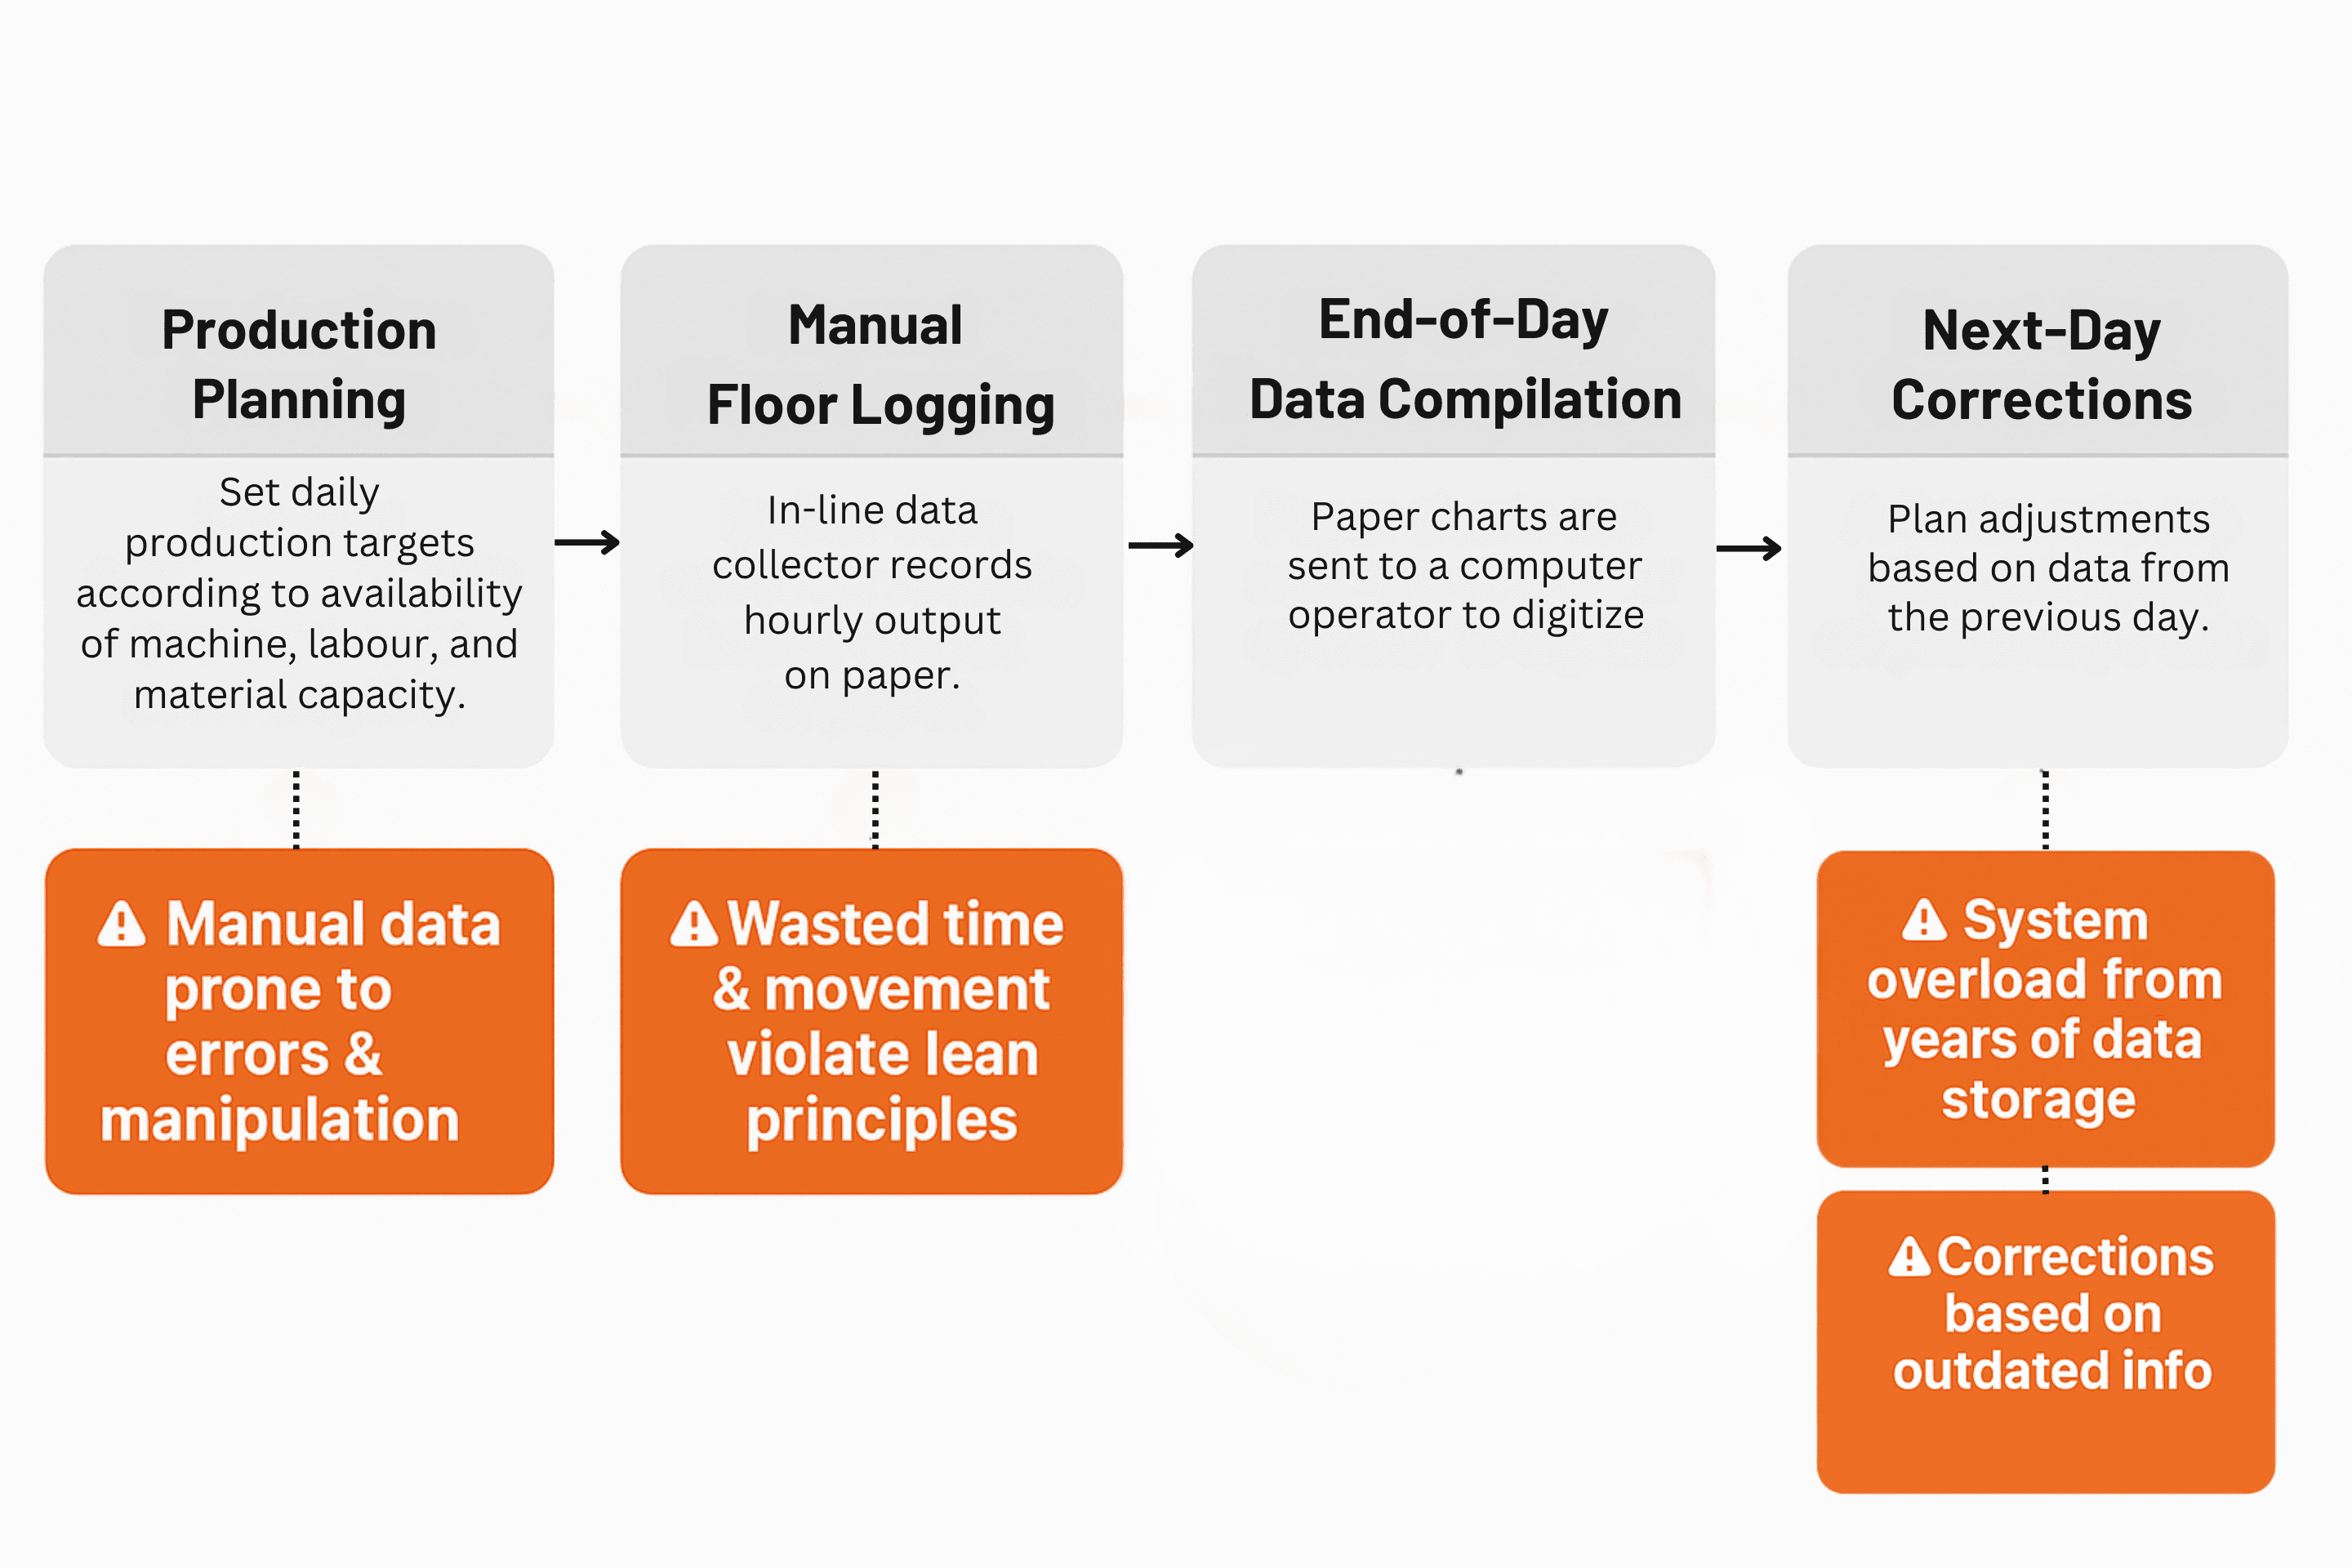
Observed: Operators defer line-output entries to breaks or shift-end rather than logging in real time.
Impact: Up to 60% of entries are delayed, letting machine jams and scrap spikes go unnoticed.
Production Management
Fragmented Alerts
Production Management
Production Management
Fragmented Alerts
Observed: Critical deviations get shared via WhatsApp instead of the formal log.
Impact: About 20% of issues never enter the official record, forcing reactive firefighting and hidden rework.
Observed: Critical deviations get shared via WhatsApp instead of the formal log.
Impact: About 20% of issues never enter the official record, forcing reactive firefighting and hidden rework.
Industrial Engineering
Manual Consolidation
Observed: IE engineers spend 1–2 hours each afternoon rekeying paper logs into spreadsheets.
Impact: Analysis always runs on yesterday’s data, making same-day corrective actions impossible
Formative Studies
Formative Studies
1
Disruptive Fit
Traditional bras failed to accommodate symmetry, shifting postures or prostheses-making dressing a daily compromise in comfort and confidence.
2
Cognative Load is real
Dressing became mentally taxing — survivors described planning outfits around pain, visibility, and prosthesis behavior.
3
Lost Identity
Overly clinical or infantilizing designs led to emotional detachment — survivors longed for products that reflected their identity, not their condition.
"Missing logs weren’t the culprit—it was the fractured flow of data and delayed alerts that destroyed trust and halted action.”
"Missing logs weren’t the culprit—it was the fractured flow of data and delayed alerts that destroyed trust and halted action.”
System Design

These revelations compelled us to redefine our design vision:
These revelations compelled us to redefine our design vision:
Embedded Real-Time Logging
Integrate data entry directly into each operator’s workflow—eliminating batch updates and blind spots.
Embedded Real-Time Logging
Integrate data entry directly into each operator’s workflow—eliminating batch updates and blind spots.
Role driven Visibility
Surface only the metrics and alerts each user needs—so supervisors, engineers, and line workers all stay aligned without noise.
Role driven Visibility
Surface only the metrics and alerts each user needs—so supervisors, engineers, and line workers all stay aligned without noise.
Unified Data Hub
Automate consolidation behind the scenes to replace manual re-keying, ensure a single source of truth, and eliminate version conflicts.
Unified Data Hub
Automate consolidation behind the scenes to replace manual re-keying, ensure a single source of truth, and eliminate version conflicts.
Zero Learning Curve
Deliver instant, intuitive screens with minimal steps—so teams can adopt the tool on day one without formal training.
Zero Learning Curve
Deliver instant, intuitive screens with minimal steps—so teams can adopt the tool on day one without formal training.
Built on ISO 9241-210 • FDA Human Factors Guidance • ISO 13485/14155
Built on ISO 9241-210 • FDA Human Factors Guidance • ISO 13485/14155
Empowering
Built on ISO 9241-210 • FDA Human Factors Guidance • ISO 13485/14155
Empowering
Empower every sewing-station operator with a one-tap, in-line mobile interface that captures production data live and feeds it into unified, role-specific dashboards and alerts—turning fragmented logs into trusted, real-time insights and hourly reports.
Empower every sewing-station operator with a one-tap, in-line mobile interface that captures production data live and feeds it into unified, role-specific dashboards and alerts—turning fragmented logs into trusted, real-time insights and hourly reports.
System Design
Login
Settings
Create Style
Attendance
Add Attendance
View Attendance
Line Allocate
Mobile Application
Data Entry
Live Dashboard
Analysis
Analysis
Style Management
Style Management
Add/View Buyer
Add/View Buyer
Add/View Buyer
Add/View Buyer
New Buyer
PPC Department
Production Department
Industrial Engineer
Decision Node

Live Dashboard Insights
Bringing real-time production data into one view reveals hidden correlations—like understaffed lines causing scrap spikes or peak-shift slowdowns. By juxtaposing daily targets, attendance, efficiency, and quality trends, the dashboard surfaces bottlenecks and empowers operators, supervisors, and engineers to adjust workflows and take corrective action confidently.
Bringing real-time production data into one view reveals hidden correlations—like understaffed lines causing scrap spikes or peak-shift slowdowns. By juxtaposing daily targets, attendance, efficiency, and quality trends, the dashboard surfaces bottlenecks and empowers operators, supervisors, and engineers to adjust workflows and take corrective action confidently.
Production Quantities Input
This one-tap entry screen guides operators through each data capture step with minimal cognitive load. At the top, an Upload Garment Image control lets users snap or select a style photo for instant visual confirmation. Below, four clear selectors—Floor, Plot, Style, and Hour—ensure every log entry is tagged with the right context.
This one-tap entry screen guides operators through each data capture step with minimal cognitive load. At the top, an Upload Garment Image control lets users snap or select a style photo for instant visual confirmation. Below, four clear selectors—Floor, Plot, Style, and Hour—ensure every log entry is tagged with the right context.


Production Quantity Review
This screen closes the feedback loop by showing operators how their logged count compares to targets. A prominent gauge displays this hour’s piece count alongside style ID and timestamp, while panels below reveal hourly target, shift goal, cumulative total, and efficiency. By surfacing all metrics in one view, operators can quickly gauge pace and adjust without manual calculations.
This screen closes the feedback loop by showing operators how their logged count compares to targets. A prominent gauge displays this hour’s piece count alongside style ID and timestamp, while panels below reveal hourly target, shift goal, cumulative total, and efficiency. By surfacing all metrics in one view, operators can quickly gauge pace and adjust without manual calculations.
Line Optimization Simulator
Born from our discovery of bottlenecks in staffing and throughput, this feature lets supervisors and IE engineers test “what-if” scenarios on crew size and line speed without disrupting the floor. By running instant simulations against historical performance, teams can identify the optimal mix of operators and machine pace to hit targets with minimal waste. The result: faster, data-driven staffing decisions, leaner operations, and a measurable drop in downtime and scr
Born from our discovery of bottlenecks in staffing and throughput, this feature lets supervisors and IE engineers test “what-if” scenarios on crew size and line speed without disrupting the floor. By running instant simulations against historical performance, teams can identify the optimal mix of operators and machine pace to hit targets with minimal waste. The result: faster, data-driven staffing decisions, leaner operations, and a measurable drop in downtime and scr

Usability &
Summative Testing
Usability &
Summative Testing
75%
reduction in data-entry errors thanks to inline validation and simplified inputs.
55%
of users reported logging and KPI review felt “dramatically faster”
of users reported logging and KPI review felt “dramatically faster”
of users reported logging and KPI review felt “dramatically faster”
8%
average efficiency uplift after supervisors applied simulator insights.
average efficiency uplift after supervisors applied simulator insights.
average efficiency uplift after supervisors applied simulator insights.
3 of 4
corrective actions were initiated within the same shift of deviation detection.
corrective actions were initiated within the same shift of deviation detection.
corrective actions were initiated within the same shift of deviation detection.
Outcome
Outcome
PORTFOLIO
PORTFOLIO
CHECK OUT SOME MORE

Human-Centered Predictive Diabetes Care
Human-Centered Predictive Diabetes Care
Human-Centered Predictive Diabetes Care

Contextual Inquiry
Photo-Diary Studies
Usability Evaluations

Reimagining Post-Mastectomy Bras
Reimagining Post-Mastectomy Bras
Reimagining Post-Mastectomy Bras
UX Research
Human Factors & Usability Analysis
Prototype testing
HAVE A PROJECT
IN MIND ?
Let's Work Together
Let's Work Together
Let's Work Together
Let's Work Together
Let's Work Together
HAVE A PROJECT
IN MIND ?